TuSimple (2021)
Automated Map Collection Task Management & Tracking Solution
AUTONOMOUS TRANSPORTATION TECHNOLOGIES
Summary
This case study focuses on lean UX interaction design techniques and interface prototyping.
I designed an automated map collection task management and tracking solution for autonomous transportation map collection teams.
Role
User Experience Designer
User Interface Designer
Team
Myself
Background
High-Definition Map Collection
TuSimple develops advanced self-driving technologies specifically designed to meet the unique demands of heavy-duty trucks. Their AI software utilizes high-definition maps that are collected by a map collection team. To design the automated map collection task management and tracking solution, I spoke with members of the map collection team.
Map Collection Managers
David is a Map Collection Manager; he usually receives mapping or map updating requests from other teams two or three times a week. David usually marks the roads on a paper map and asks his teammates, the Map Collection Engineers, to drive the mapping vehicle through the route he marked on the map to collect map data.
Map Collection Engineers
Janice is a Map Collection Engineer. Usually, when there are mapping tasks, she will team-up with a driver, and drive the mapping vehicle out to collect HD map data that the other team requires. The process is painful and chaotic because Janice needs to continuously look at the map to make sure that the vehicle is on the right road.
Task Management & Tracking Challenges
David needs to keep track of every ongoing map collection task and is responsible for the mapping report collection after engineers return from trips. David usually drives virtually through Google Street View to note potential difficult mapping spots for his team members before starting a trip.
Map Collection Challenges
Since the routes that need to be collected are usually not simply just point A to B, Janice is unable to directly use Google Maps. The driver and Janice also need to follow the map collection protocols while on the road. A trip will sometimes take a few days and there are various logistical issues they need to solve - such as when and where to have lunch and dinner. Where to collect fuel and where to take bathroom breaks.
Process
Research
Problem Statement
Analysis
User Personas
Hypothesis Chart
Design
Sketching
System Workflows
Wireframes
Hi-Fi Prototypes
Research
Project Brief
I began by studying the project brief to get a clear picture of the challenges and identify any important constraints. I used the information and some assumptions to create a problem statement made up of three elements:
The current goals of the product or system
The problem the business wants addressed
An explicit request for improvement that doesn’t dictate a specific solution
Our current map collection task management and tracking system was intended to enable Map Collection Managers to efficiently track every map collection task and precisely communicate mapping mission details with Map Collection Engineers. We have observed that the current system isn’t meeting these goals which is negatively impacting the efficiency of map collection projects and creating safety risks for Map Collection Engineers and Drivers in the field. How might we create a system that improves efficiency of map collection task management and tracking, reduces data collection errors, and improves the safety of Map Collection Engineers and Drivers?
Analysis
To keep the users front and center in my thinking I created user personas for David and Janice. I made the assumption that David works in an office on a desktop computer. He wants to keep projects organized and help the Map Collection Engineers reduce data collection errors. Janice works in the field. She wants to keep herself and her driver safe while accomplishing collection missions as efficiently as possible.
I listed the business goals that I identified during the problem statement exercise; reduce errors, increase efficiency, and improve safety. Then I brainstormed what user outcomes David and Janice would need to achieve to accomplish those business goals. Finally I brainstormed a digital solution with features that would help David and Janice achieve their user outcomes.
Design
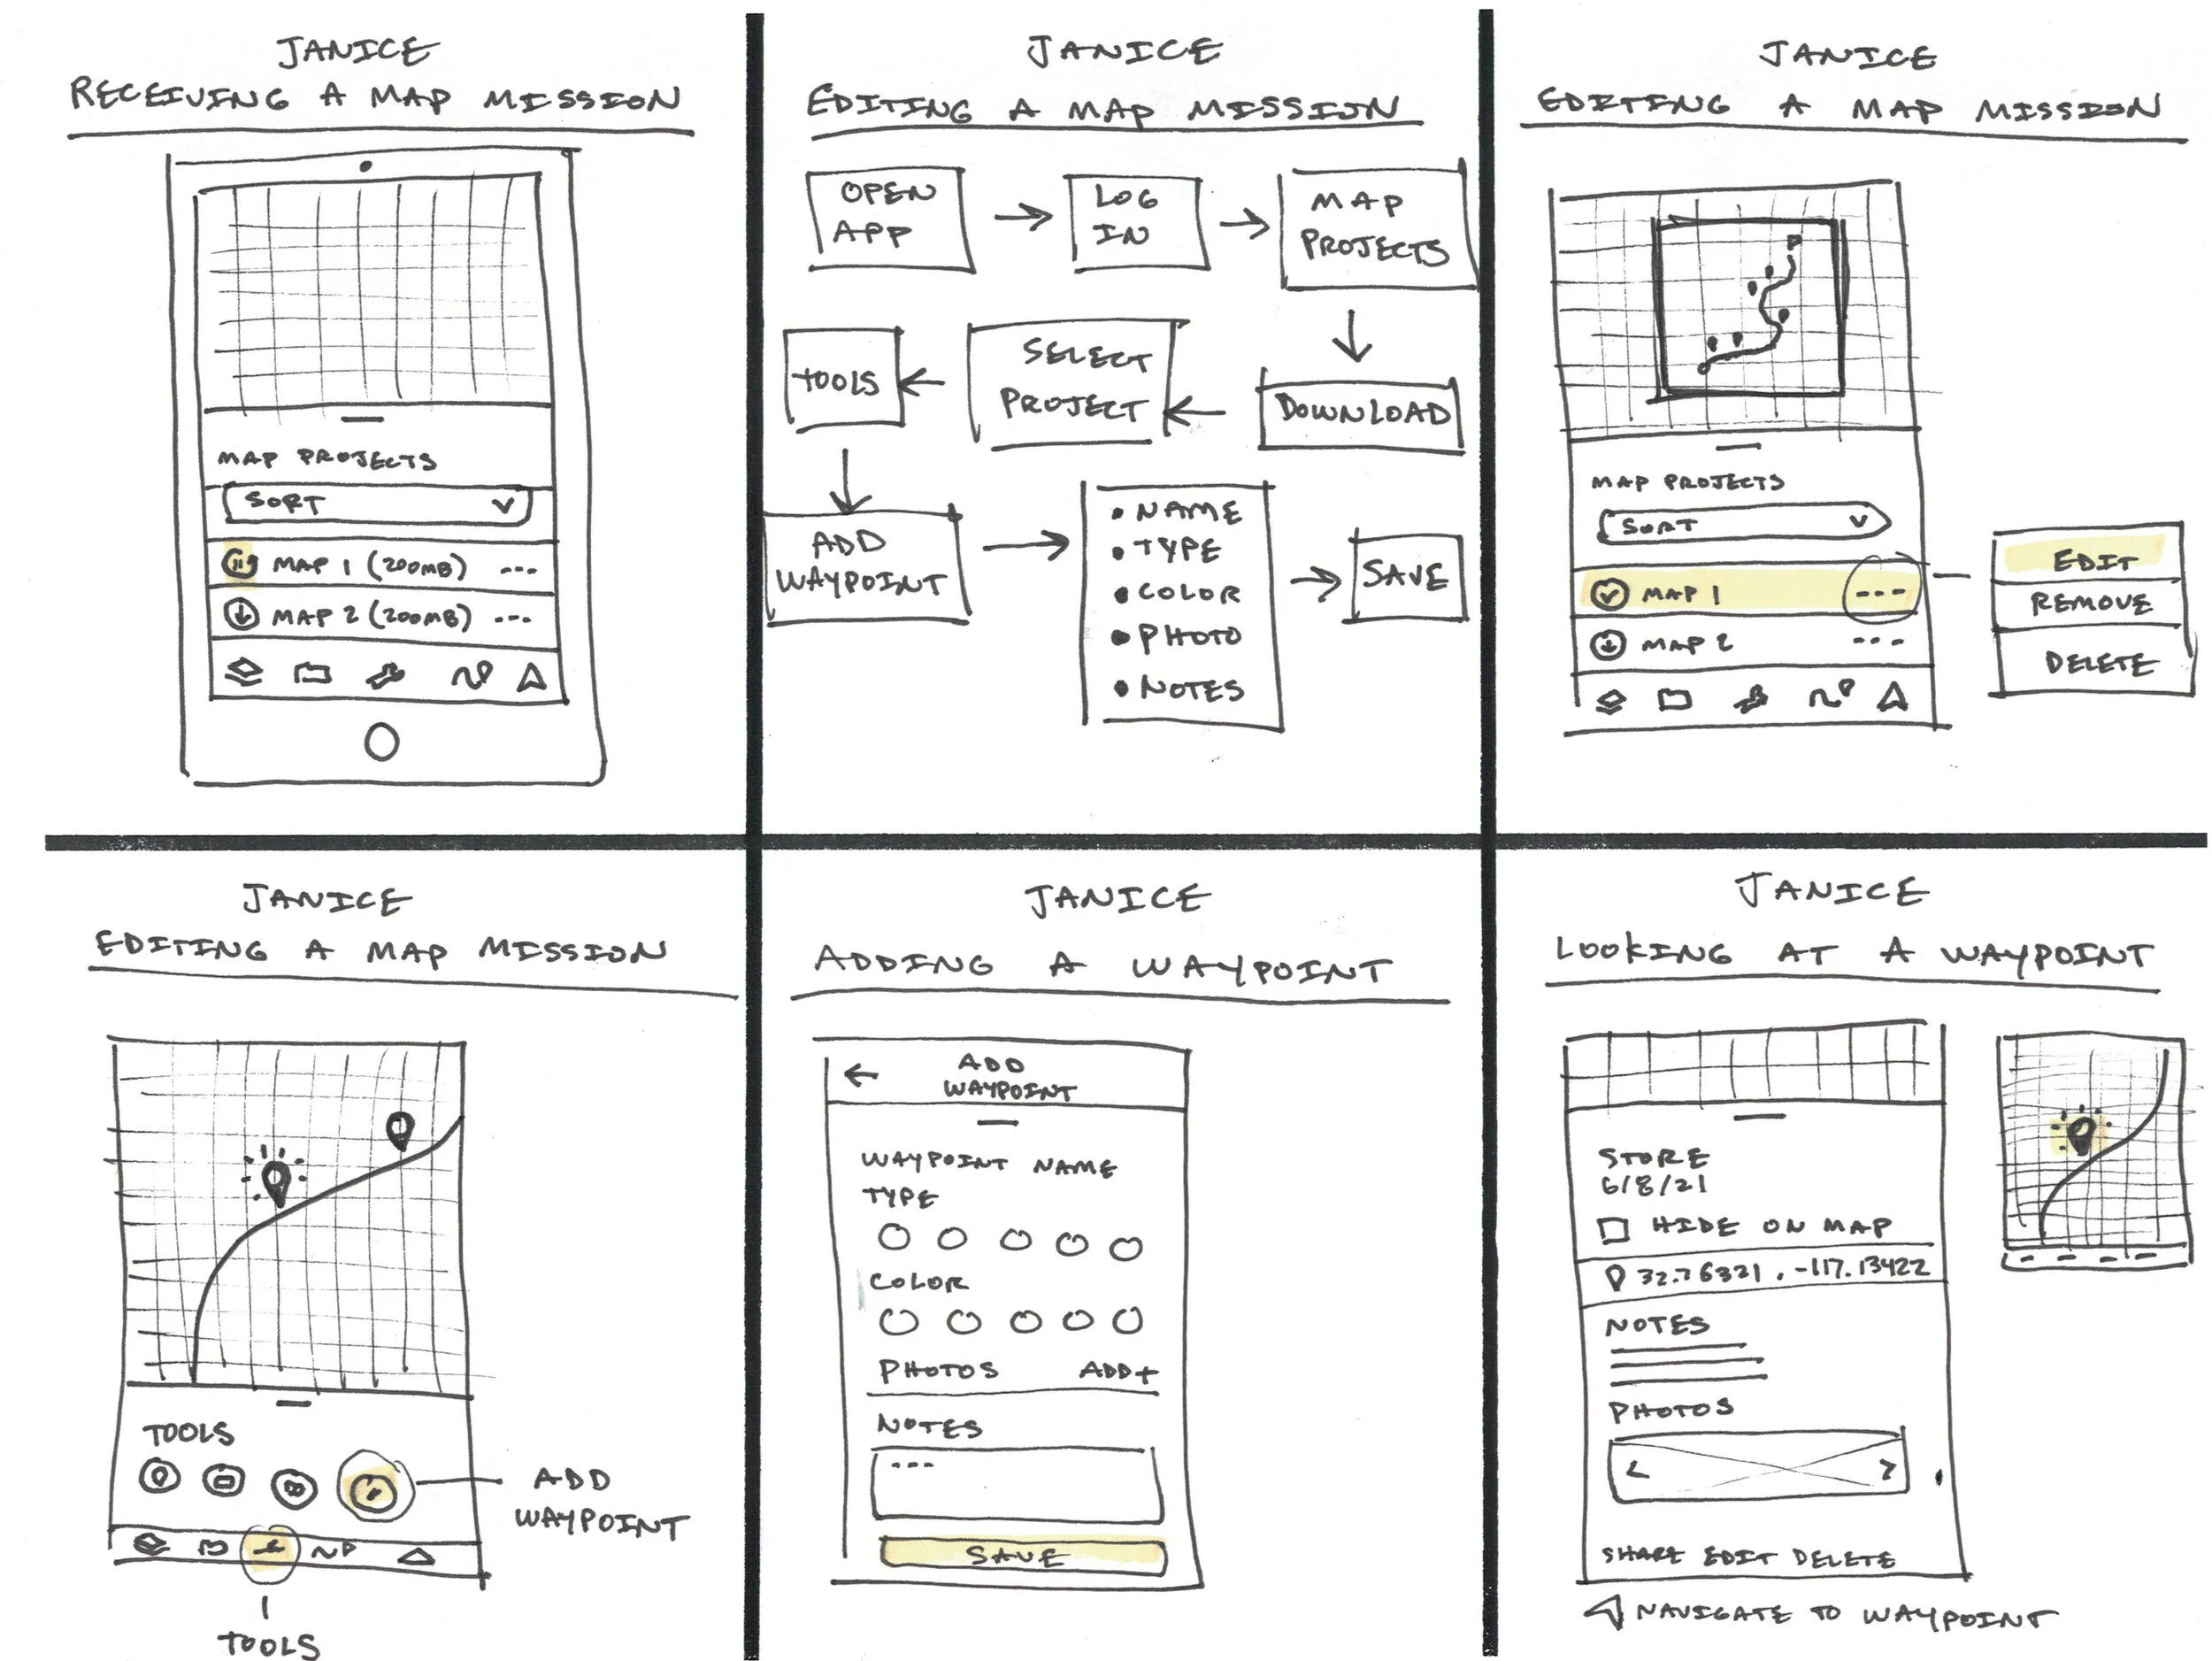
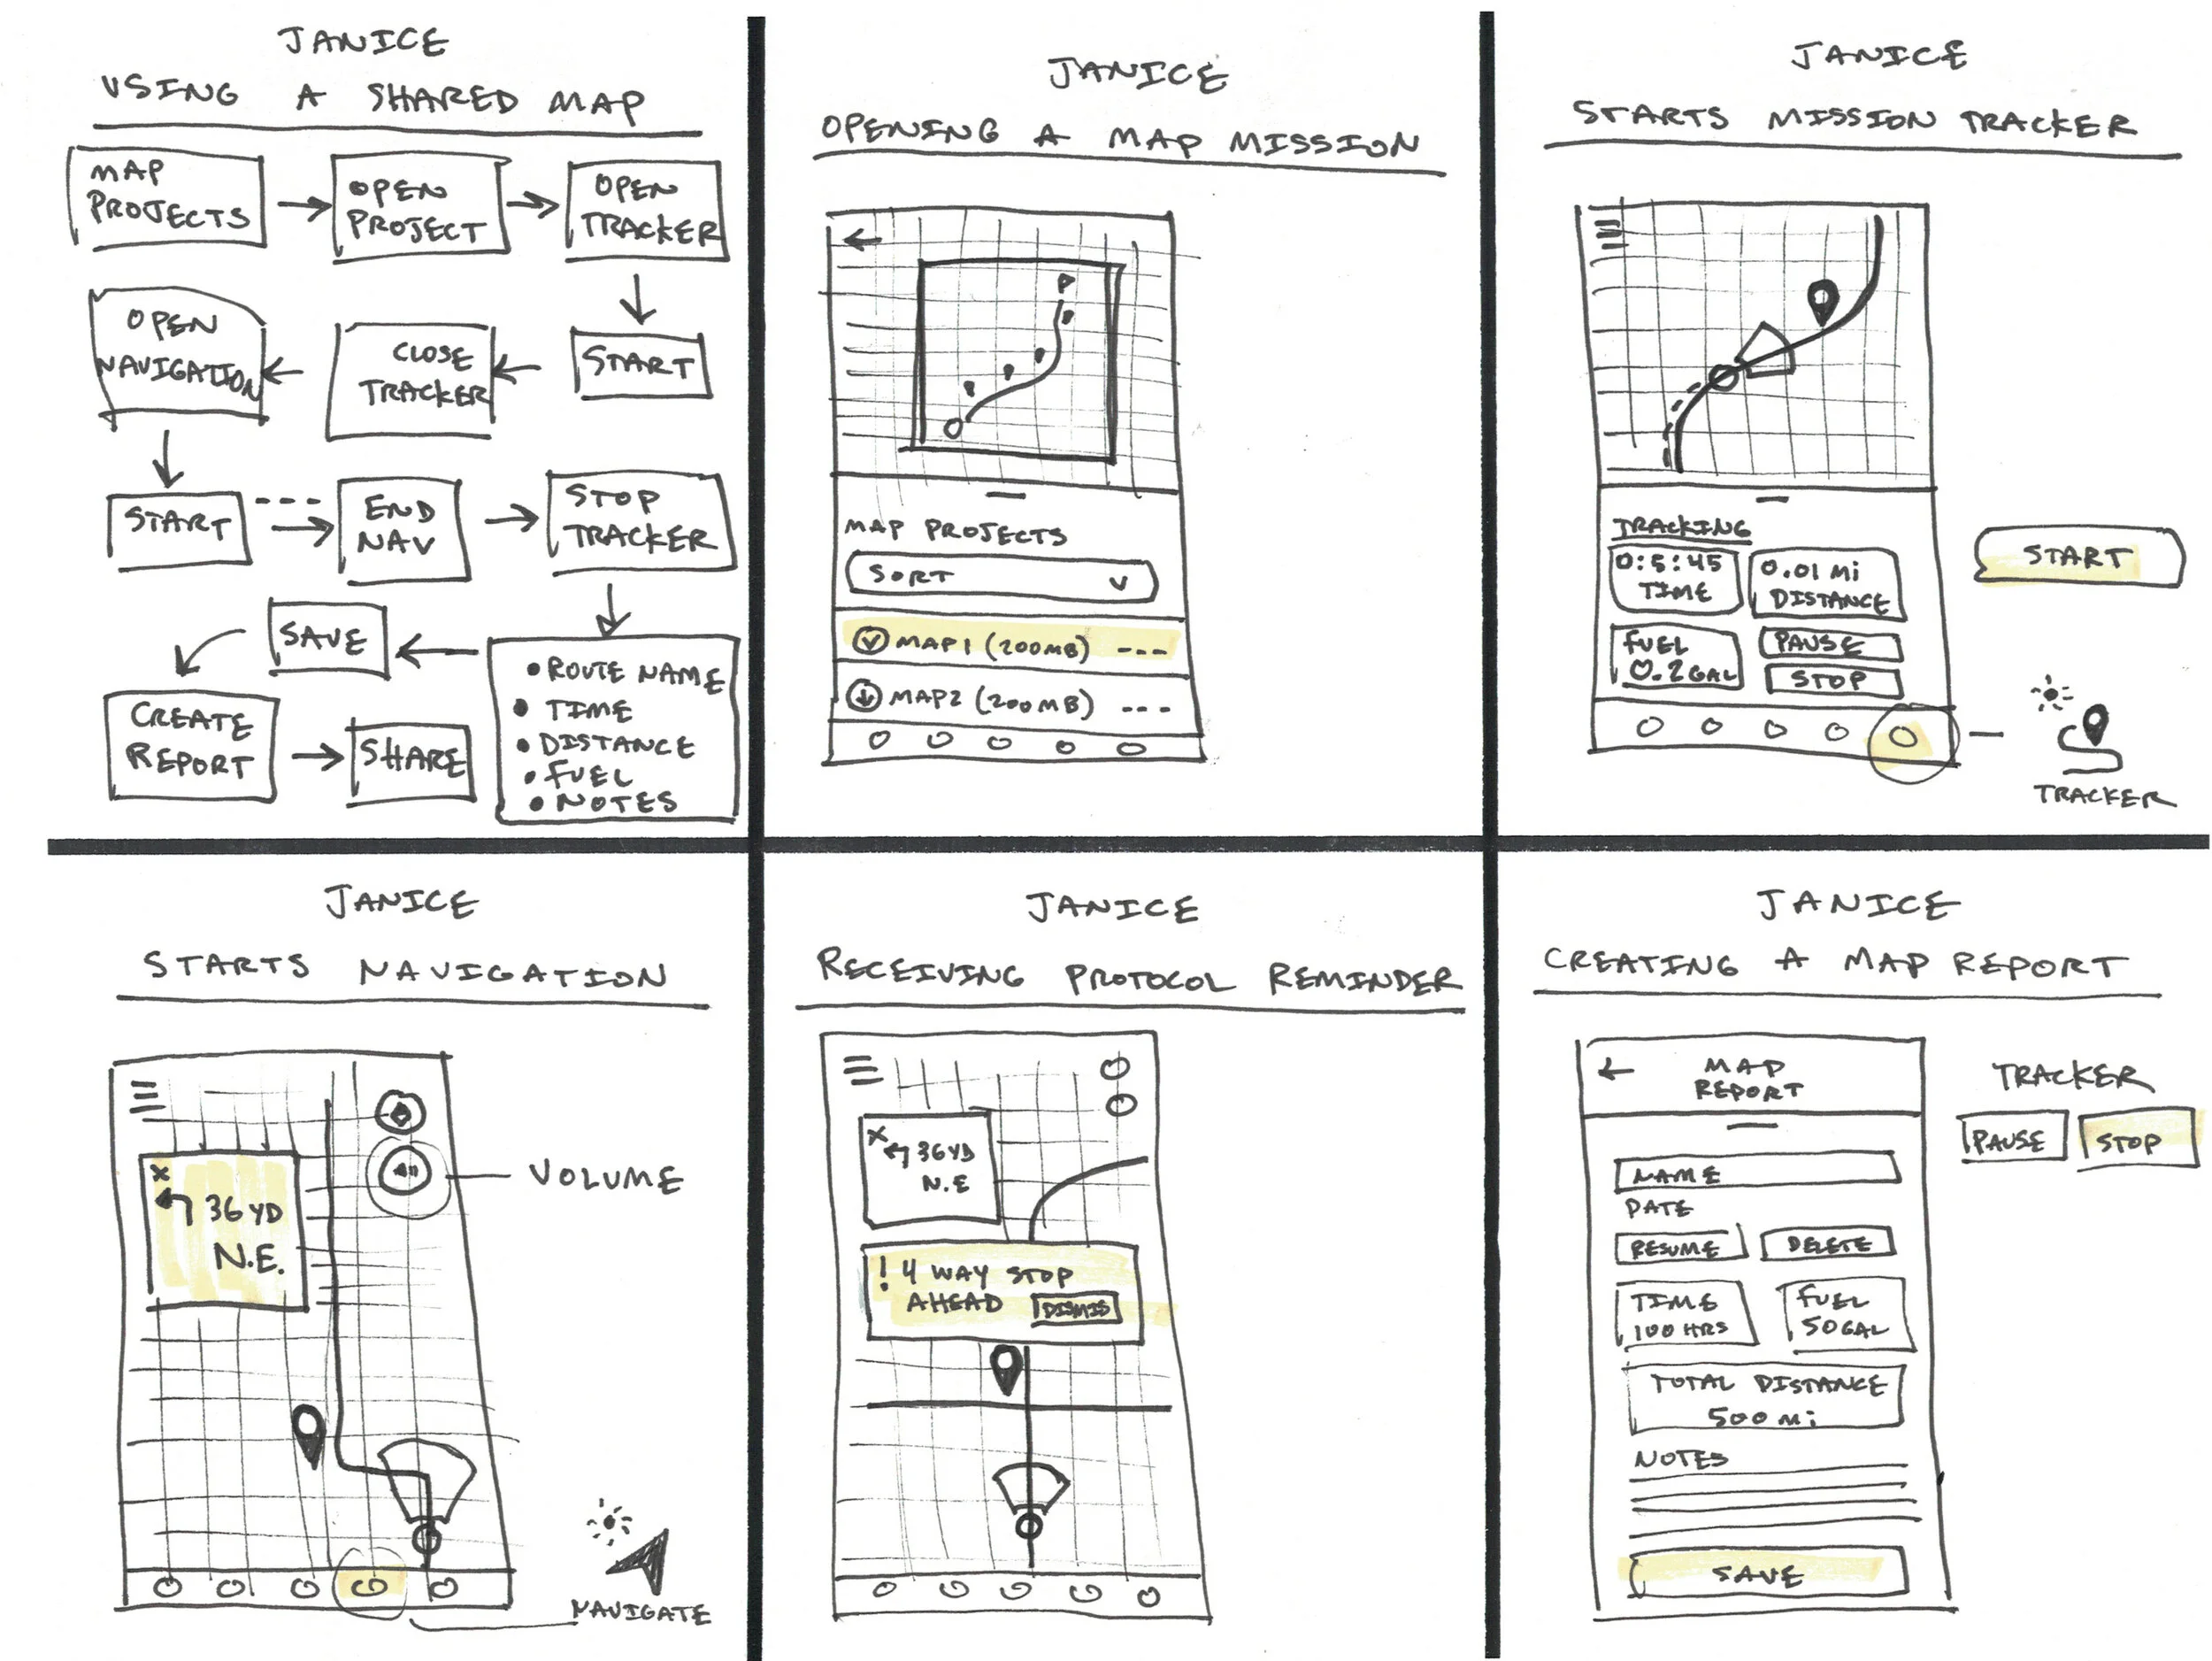
I generated low-fidelity sketches of the features and solutions including UI sketches, task flows, and diagrams. It became apparent that there would need to be 2 versions of the product that communicate with each other. One used by David to create maps in the office and manage collection tasks, and one for Janice to be used in the field for navigation and tracking.
I took the task flows from my sketches and elaborated on them to create system work flows. I used Adobe XD to map out likely scenarios for David’s desktop solution and Janice’s mobile solution, and how the two would work together. I included screens, interactions, and decision nodes.
I used the system work flows to identify the key product screens and designed wireframes for them in Adobe XD. I drew inspiration from other mapping applications and utilized the Apple Human Interface Guidelines for the preliminary interface design.
For David’s “creating a map collection project” scenario I wireframed 4 key screens for use on a desktop computer (1920 x 1080). For Janice’s “using a map collection project” scenario I wireframed 4 key screens for use on a mobile tablet (786 x 1024).
Prototypes
Since I made the wireframes in Adobe XD it was efficient adding aesthetics and interactivity to produce a prototype. I followed the Apple Human Interface Guidelines for the layout, font sizes, and color palette. I used color sparingly to call attention to important information and referred to the WebAIM Contrast Checker tool to make sure that there was adequate contrast. I utilized Adobe XD UI kits for other assets like icons, buttons, and fields. I selected common, recognizable icons to help speed up user interaction.
Click on the prototypes below to see the high-fidelity interface concepts and test drive some of the features.

View next case study
SPORTFISHING OUTFITTERS


